Designed for sailors and commercial shipping on the Dutch inland and IJsselmeer.
 Stentec’s „Vaarkaart Nederland“ is published annually on DVD and as a advantageous download with a free WinGPS 5 Lite for Windows. You can also install this chart on your Android™ tablet or smartphone with our WinGPS™ Marine apps.
DKW Vaarkaart Nederland 2014 summed up
- More than 1100 marinas with phone number and website
- Berths for boating, Marrekrite and gas stations.
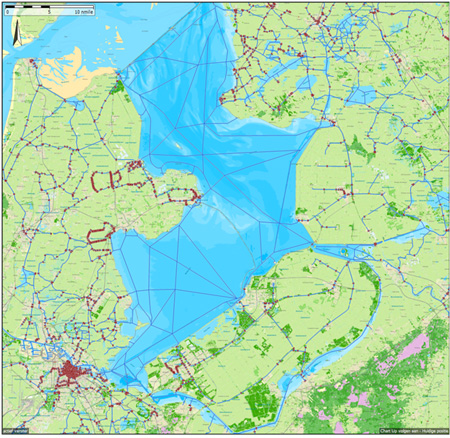
- Depth image Ijsselmeer with 2013 depth points and waterplants coverage.
- Unique depth image of the Biesbos, Frisian lakes and Westeinder.
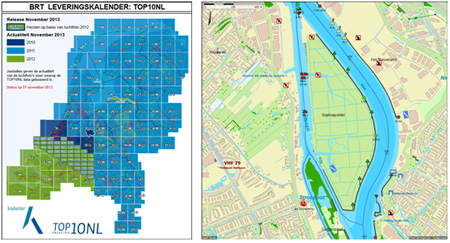
- New TOP10NL base chart of November 2013.
- Scale 2.5 m/pixel for greater detail and a sharper chart image.
- 15 Billion pixels packed into just 1.5GB (CHV file).
- DKW Hybrid format for WinGPS with a whopping 26,000 waypoints (such as buoys).
- Available for Windows and Android with at least 2.2 GB of free storage memory.
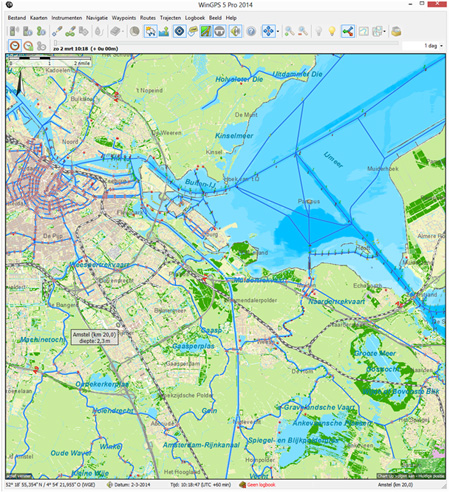
- WinGPS 5 2014 recommended for ultimate display (see figure below).
About the source material.
With the use of additional information sources and with the processing of comments and suggestions from many boaters, Vaarkaar Nederland gets a lot of improvements every year.
The base chart is based on the TOP10NL of the land register (formerly Topographical Service) released November 2013. This chart is completed with Inland ENC charts, depth image, depth soundings 2013 of the Ijsselmeer and Biesbosch of the RWS (Department of Public Works).With 2013 sonar measurements of the Westeinder Sport fishers, depth image frysian lakes, and the data from the harbor chart PortOfAmsterdam.
Beschrijving van Vaarkaart Nederland
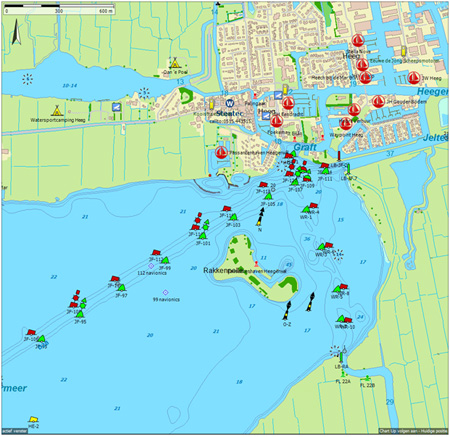
The hybrid chart format supports a detailed chart with a grid overlying (vector) chart information database such as buoys and depths. This chart format is optimized for WinGPS 5 2014 and our WinGPS Marine Android apps. Vaarkaart Nederland 2014 includes the following components: Detailed chart, an overview chart, waypoint database, chart collection and legenda.
The scale of the detail chart is 2,5 m/pixel. Or approximately 1:9000 on your screen. This is slightly more detailed than the detail chart of Stavoren of the chart DKW1810 (1800 series), but then for the whole of the Netherlands. The overview chart with scale 20m/pixel connects perfectly with the detail chart when zooming. The scale of this chart is approximately 1:72,000 on your screen and has 75% more overview than the 1810.4 chart of the Ijsselmeer.
The overview chart with 8 times the scale is 64 times smaller than the detail chart. On PC, tablet or smartphone you need 2,2GB of memory for the both of these charts.
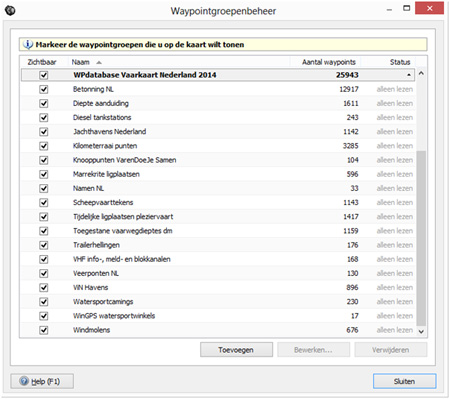
The waypoint database has waypoint groups which you can set up yourself in WinGPS 5 for an optimal chart view. This database gets updated several times per year. You can download these update automatically with WinGPS.
New in Edition 2014
The TOP10NL base chart is based on the latest version of November 2013. This is based on aerial photos of 2010 to 2012. We see that the charts are processed better. A good example is the Sophia polder, like you see in this image.
You can zoom 20% further on the detail charts compared to the 2013 edition. On the 44% bigger chart surface, AIS ships and marina icons will be represented better.You can zoom 50% further on the overview chart which is way more detailed than its predecessor. Because the difference in scale between detail and overview chart is decreased, zooming on the chart feels more natural than ever.
The chart set in WinGPS 5 gives a crystal sharp chart image on every zoom level, which will feel more natural. The 2014 edition gives you more information, you can also see this in the size of the CHV package, which is 1,5 GB (compared to the 1,1 of its predecessor).
The color scheme is copied from Vaarkaart België 2014. The bright or faint colors are edited for a well-balanced chart view. For example; the new colors make the buildings pop out more. It will look more vibrant on older monitors. On modern monitors or screens the chart will give you a clean, vibrant and sharp view.
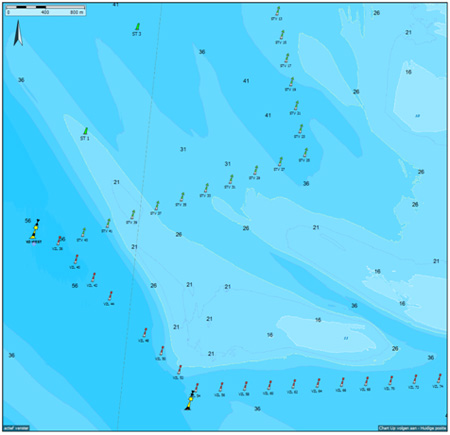
Enhanced depth image with water plants.
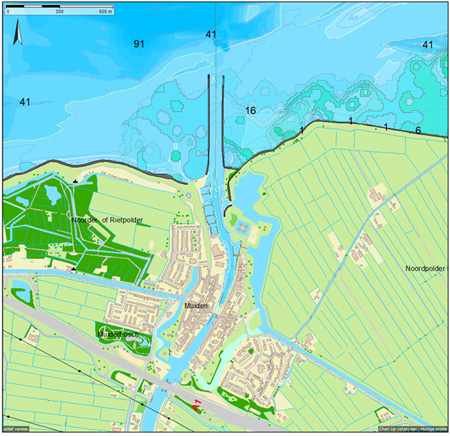
With 2013 measuring points of the RWS we created a new depth image of the IJsselmeer. For extra safety we colored the 1,5m and 2,5m NAP-depth lines white and yellow.These depth lines show you the sailing area for ships with a depth bigger than 2 meters. You can now see the water plant coverage on the detail charts so you can safely sail the Randmeren.
About the Depth in NAP and Wind
The summer level on the IJsselmeer and Markermeer is 2dm lower than NAP, and the winter level is 4dm lower. On the Hydrographic charts of this area (1810 and 1803) it shows the depth relative to NAP. In the summer (April to October) the true depth of the Ijsselmeer is 2dm less than Vaarkaart Nederland and 4dm less than the winter level on the 1800-series. At least, without wind included.
To prevent stranding your ship, you can use the NAP depth contour of the chart. If you have a ship depth of 1 meter, stay inside the white 1,5m line. In the summer this is 1.3m. Ships with 2 meter depth have to stay inside the 2,5 NAP depth contour (with summer depths of 2,3m). The 30cm margin is needed to rule out local, not measured low depths.
The wind can cause the depth points at the coast to vary up to 50cm. With a storm the depths can reach a difference up to 1 to 1,5m depending of the wind direction.
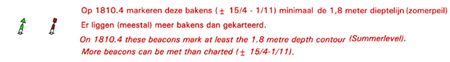
The red beacons mark the minimal 2m depth line (NAP), like you see here at Vrouwezand. On the outside of this line its 1,8m or higher in the summer period. At least, without wind included.
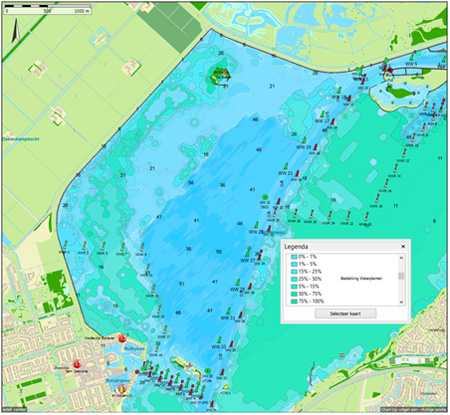
Coverage water plants IJsselmeer
In the summer you will find limited depths along the shore of the Randmeren. Possibly this caused the drop of %50 less boaters in these areas. Last year a lot of water plants were harvested to reduce hindrance.
At the detail chart you will see the base measurements by RWS in 2010, where the coverage of water plants can be expected, so that these locations can be avoided. Generally these plants are covered by the 2m NAP calculations, but not always as we can see at the Veluwemeer at Harderwijk.
At Vaarkaart Nederlands 2014 applies; the greener, how higher the coverage. Also see the legend. The coverage is transparent so you can still see the depth image.
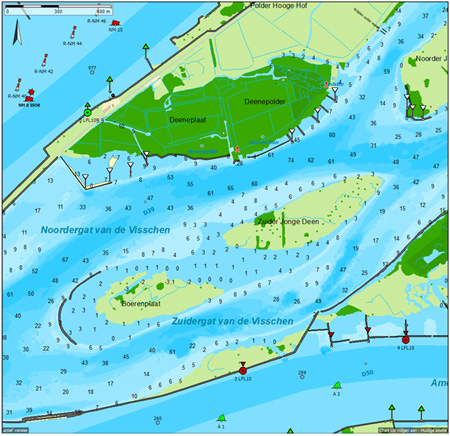
Recent depth image biesbosch
Vaarkaart Nederland has an unique depth image of the Biesbosch on base of the most recent data of the RWS (2013). The depth image shows gradations from white to blue, with added depth numbers in NAP.
The Biesbosch is subjected to approximately 2dm tidal variation. Average low tide (GLW) is 1,5dm above NAP, so the NAP depth numbers on Vaarkaart Nederland at GLW have a 1,5dm margin for winds. Average high tide is 3,5dm above NAP.
To summarize: for the Biesbosch: GLW=NAP+1,5dm and GHW=NAP+3,5dm.
Depth image Westereinder Plassen
With sonar measurements of 2013 of sport fishers in the Netherlands there are depth lines and points drawn at the Westeinder Plas at Aalsmeer. The depth can be found at the line itself. White is the 2 meter line, and red is 1,5 meters.
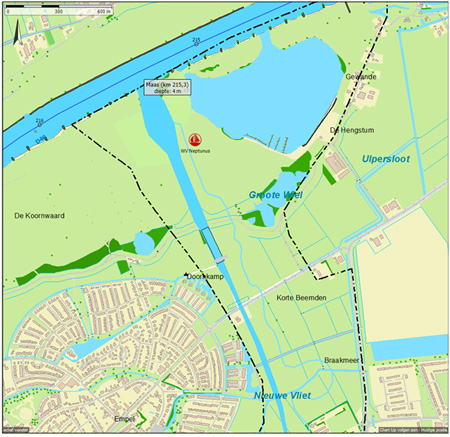
Maximaalkanaal open end 2014
The Maximakanaal at den Bosch is already drawn in the chart with data of RWS. The first ships have sailed through the canal, which will be opened officially in December.
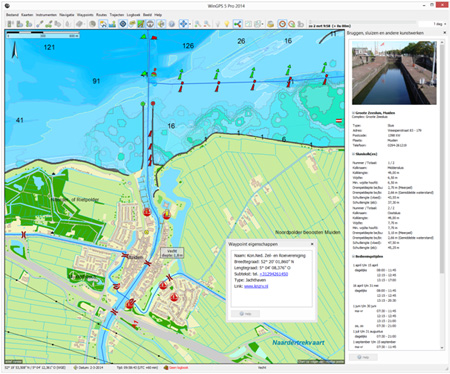
Depth Image and buoyage province Fryslân.
Vaarkaart Nederland contains depth lines from the measurements of 2009&2012 from the Frisian Lakes Project, like developed by Stentec in cooperation with Province of Friesland. The buoy data is accurately positioned.The moving of the buoys will be included in the online database updates. For example after dredging of the navigation channel.
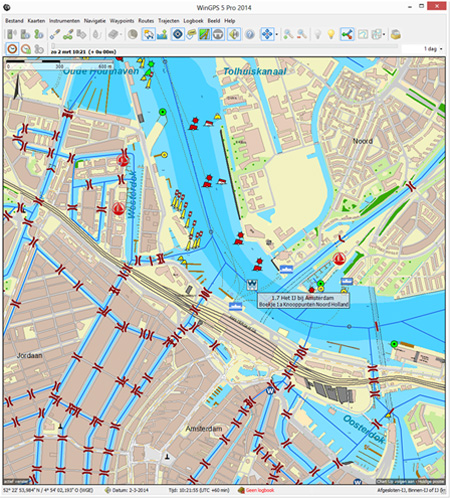
Vaarkaart Nederland with WinGPS 5 2014.
In WinGPS 5 2014 you can switch the visibility of vector objects for a clear and understandable chartview.
- Bridges & Locks, with the grey and round button at the toolbar.
- Waypoints, where waypoint groups via waypoint/group management can be set (see image)
- Waypoint names, incl. bridges & lock names.
- Waterway network.
Finally, the waterway network of WinGPS 5 2014 is expanded with the Amsterdam canals and with pictures of almost all the bridges. Ideal for dinghy sailors. Below is a screenshot of WinGPS 5 Pro.